The bicycle finds its place amid daily mobility

04 November 2015ContactJérémy Courel, Dominique Riou

The last comprehensive transportation survey (EGT) from 2010 shows that the number of journeys using a bike have doubled in Paris since 2001. If this trend remains uncommon in regional mobility, strong signs of revival are showing in the local areas. For example: Paris.

Exceptional growth of the number  of trips by bicycle, breaking from a long period of decline  during the 1970s and 1980s (see diagram 1). Over the 1990s, things stabilised, and we have noticed an emerging recovery. Since the beginning of the year 2000, this recovery has been confirmed and accelerated with a current usage level slightly higher than the 1970s (650,000 trips against 590,000 in 1976). However, given the increase in population and individual mobility, the modal share of cycling is still slightly lower today (1.6%) than in 1976 (2%).

We move around twice as much by bicycle than ten years ago

Between 2001 and 2010 the number of daily trips done exclusively by bicycle has doubled to attain 650,000 trips (of the 42 million daily journeys of the Parisians). The bicycle is also used in addition to public transport, bringing the total number of trips using a bicycle, for a part of or for the entire route, to 715,000 a day.

School, work and leisure: an evolution of urban trips by bicycle

If the overall volume of bicycle trips has returned to a level comparable to that of the 1970s, the structure of activities motivating this has evolved considerably (see diagram 2). In the 1970s, bicycles were mainly used to get to school (almost a third of the trips) and work (a fourth). Since then, the use of bicycles by students has significantly decreased: from 180,000 daily trips to 60,000, and in general the use of bicycles for going to school is now three times lower that it was (less than 10% in 2010). At the same time, the use of bicycles to travel to work has increased slightly: with 190,000 travelling to and from work on a daily basis, these represent about 30% of the bicycle trips today, and therefore forms the first reasons for this usage. But the most important change concerns the use of bicycles as a leisure activity, so the number has more than doubled. This is originally the reason that one in five bicycles are used to get around (22%).

Bicycle use according to the activity motivating the trips in Paris Region
For nearly four decades the main developments for the purpose of bicycle trips relates to:
• Commuting that was already significant in 1976 was further strengthened, especially driven by the increase in usage by the executives and intermediate professions, to become in 2001 the prime motive to use a bike.
• The number of home-study trips, which shows the largest decline, is explained by a collapse of the bike mobility that was used to get to school.
• The home-recreation trips, whose numbers have more than doubled, marking the most noticeable progress.
Secondary linked or not to work: the reasons for trips that are considered here are either linked to the home (home to work and back, from home to the shops, and vice versa, etc.), or not linked to home and, in this case, qualifies the secondary trips. If their origin or destination is work, then these are the secondary work-related trips; otherwise they are secondary trips not linked to work.

The distances travelled that increase for all types of travelling purposes

Cycling is a mode of transport that is close to home, within a range(1)  of 2 km on average. This average range was only 1.2 kilometres in 1976. It has practically doubled since this date. Moreover, this increase in distance travelled by bicycle covers all types of trips: the average range of commuting has increased by 50%, from 1.7 to 2.5 km; the home-leisure travel has more than doubled, moving from 1 to 2.3 km.

This increase indicates that there are more and more users that accomplish the trips that previously they might not have done by bicycle, given the distance. This shows that the relevant area tends to increase and cover an increasing share of daily bicycle trips, knowing that in total, two thirds of the trips performed in the region have a range of less than 3 km, and that this share is still 50% for car trips only.

A development that is not just a matter of bobos(2)

With the increasing scarcity of using a bicycle to go to school, bicycle mobility used by the youngsters has collapsed. In 1976, half of the bicycle trips were made by pupils and students (36% for the 6-14 year olds). Today, this portion is just over 20%, even though their importance in the population increased slightly (from 21% to 23%).

The labourers form another category, where bicycle mobility has greatly reduced: 15% of trips in 1976 to 7% in 2010. But this decline is linked to that of their importance in the population, which has decreased in the same proportion: today the labourers still use the bicycle as they did before, but there are fewer labourers.

However, two categories saw their bicycle mobility increase sharply: executives and middle management. Admittedly their importance in the population has largely increased, especially for executives, and combining the two categories from 18% to 26%, but their importance with regards to the bicycle mobility itself, has practically increased tenfold: 4 % to 38%.

Over the past ten years, we have seen a strong increase in cycling by women. Their contribution to the use of this mode of transport increased the trips from 30% to 40%. However, it is more of a "return to normal": this was already the case with 40% in the 1970s.

Assessment 2012
The cycling facilities in Paris
. Since 2000, the cycling linear in Paris has almost tripled: from 1,375 km in 1999 to 3,532 km = more than 160%.
. The municipalities in the heart of the urban agglomeration, Paris and the neighbouring departments, have strongly developed their network: from 129 km in 1999 to 545 km = more than 300%.
. For the municipalities of the Hauts-de-Seine: from 58 km in 1999 at 253 km = more than 340%.
. The outer suburbs have not been left out: 2,245 km = 63% of the regional linear.
[LOPES, 2014]

A risk of cycling that has decreased

Cycling in the city is not without risk, as with any travelling activity, but is not abnormally dangerous, contrary to the image that this mode of transport still suffers from. In 2001, the Road Safety Observatory of Paris counted 1,064 casualties and 22 killed, against 1,090 casualties and 15 killed in 2010 among the cyclists involved in road accidents on the regional territory. The fact that the accident data concerning bicycles were stable over the period 2001-2010, while the usage doubled, allows for a conclusion that the risk has decreased.

The statistics of accidents with regards to bicycles remain difficult to interpret and evaluate, as it is a practice that remains under-represented. In fact there is often a confusion between sporting uses (leisure activities) and commercial purposes (commuting), such as the confusion with the higher accident rates of motorcycles.

Studies have however shown that the risk of a cyclist being injured by a motorist varies inversely with the amount of cyclist traffic.

The policies in favour of the bicycle and walking seem to be the safety of pedestrians and cyclists. The prevention however remains essential, especially concerning the risks of accidents with heavy vehicles. This type of accident represents only 5% of those involving a cyclist, but it includes only a third of those cyclists killed in urban areas [Certu, 2010].

A clear emergence at the local area scale of travel

In the vast mass of the Parisian commuters (42 million per day), the amount of commuting exclusively by bicycle certainly has doubled in ten years: from 305,000 to 650,000 per day. However, its share (all modes of transports included) in the regional mobility remains low: 1.6% in 2010 against 0.9% in 2001.

Yet this doubling of the number of bicycle trips is surely the consequence of a phenomenon at work, but that the regional focal distance hasn’t given an overview. If the bicycle development is in some way cut at a regional scale, it is of the areas and the mobility practices where, on the contrary, are becoming very visible. Thus, the daily bicycle mobility can reach some Parisian areas up to 0.24 trips per habitant per day, while it represents on average only 0.06 over the region.

These are in the sectors of the heart of the urban agglomeration that the practice is the highest, but we have noted however, a great disparity of the levels.

In the same manner the peripheral sectors displays results equivalent to certain town centre sectors. Clearly, many factors beyond the urban morphology, endorse the cycling practice: quality road improvements made in its favour, the profile of the individuals, constraints related to car use.

Number of bicycle trips per person per day
(according to the breakdown of the overall transportation survey -EGT-)

If the heart of the urban agglomeration like Paris joins good conditions for the use of the bike (short distances, especially commuting, a bicycle network, Vélib service, etc.), there are areas where this mobility practice is particularly prominent. A daily mobility which can reach up to 0.24 trips by habitant, for a regional average of 0.06.

Urban areas of Paris Region, 10 minutes from a bicycle station

70% of the Parisian population are 10 minutes by bicycle from a station (an estimation of 13 km / h). The potential of cycling as a feeder service to the stations is very important. Thanks to its operating flexibility, it enables significant time savings on this type of trip. It does not generate congestion when approaching the train stations and mass parking is possible on small surfaces. The question of the quality of the bicycle facilities remains essential as well.


Paris sees its daily bicycle mobility take-off

A look centred on Paris sheds light from a well observed example, a new reality of the bicycle mobility. Paris is a very dense area, which is well covered by the comprehensive transportation survey, with 14 random sectors.

The use of bicycles has tripled in ten years and accounts for 3% of the internal trips in Paris, more than twice of the average Paris region. It is true that this area joins together particularly good conditions for the use of the bicycle: by the density of the urban situation; short distances, especially for commuting; a cycling network; a bicycle self-service (Vélib'), well developed; but also strong limitations for cars.

Yet fifteen years ago this didn't seem to be an obvious future. In the 1970s, 1980s and 1990s, the use of bicycles in Paris was almost non-existent, with approximately 20,000 daily trips and a modal share of less than 0.5% (see diagram 3).
It was only from 2001 with 80,000 bicycle trips that the modal share of cycling in Paris (1.3%) surpassed those observed on the regional scale. With 240,000 trips in 2010, the use of bicycles tripled in Paris and this increase accounts for almost half of the doubling recorded of the bicycle use in Paris. It must be remembered that Paris had only 6 km of bicycle paths in 1995, against 540 km today.

Cycling counts for 8% of the internal mechanised trips in Paris

The largest proportion (about 60%) of internal travel in Paris is done on foot. If one takes into account that the other trips, that is to say, those resorting to mechanical means of transport, the use of the bicycle rises to 8% on the whole. This is well below the public transport in this perimeter, but quite comparable to other mechanized methods used for getting around Paris. These represent 240,000 daily bicycle trips in Paris against only 540,000 by car.

This report shows all the relative importance of the bicycle in comparison to the car as an individual mode of transport, in a dense urban environment, and the proximity. Previously bicycles seemed to have retired, but since 2010 the bicycle is more widely used than scooters or motorcycles in Paris: there are fewer than 150,000 daily trips made on two-wheelers inside the capital.

Cycling accounts for 16% of the mechanised internal trips in Paris carried out on public roads

The public transit network in Paris is very developed and gives structure to a large portion of the mobility. Taking into account only the modes of transports using the roads to calculate the modal share of the bicycle, helps to shed some light on the multi-modal sharing issues of the public road space.

So, the 240,000 bicycle trips accounts for 16% of a total of the 1.5 million internal daily trips in Paris, carried out on the roads by private car, taxi, public transport (bus, tram) and motorised two-wheelers (see diagram 4).

The bicycle accounts for 8% of the internal home-work trips in Paris

On the regional scale, the "work" motive is structured around the use of a bicycle. It is the same for internal trips in Paris: commuting also accounts for nearly 30% of all bicycle trips. In this constrained mobility, which is very important in daily lifestyles, 70,000 trips are made by bicycle in Paris, that is 8% of all internal commuting in Paris. Similarly, the data from the EGT at the regional scale reveals that unless it is (re) feminised, cycling remains a masculine practice. They also shows that today that the higher socio-professional categories are the majority of the users.

By refining these two analysis fields on the cycling practice in Paris and its modal share in internal commuting in Paris, the male executives reached 13% that is nearly 24,000 daily trips.

It is less dangerous to move around Paris on a bicycle than on a motorised two-wheeler

In 2010, the road safety statistics counted, in Paris, 4,275 users of motorised two-wheelers involved in an accident (17 killed and 391 injured and hospitalised), against 554 involved cyclists (2 killed and 32 injured and hospitalised).

Those who are injured and killed on a bicycle are 12 times fewer than those on  motorised two-wheelers, while these two modes of transports have an equivalent importance in transportation linked to Paris(3): 284,000 on bicycles against 278,000 on motorcycles for an average travelling time, and therefore the exposure to risk is also comparable.

The bicycle accident rate is not distinguished in terms of severity in the Paris accident rates, quite the contrary. In 2010, we thus counted 5.6% of fatalities or injured and hospitalised among the cyclists involved, against 13.5% for pedestrians and 9% for users of motorised two-wheelers. As at the regional level, the bicycle accident rate increased slightly in Paris (5 killed and 378 casualties in 2001, against 554 casualties and 2 killed in 2010(4)), but compared to the tripling of the number of trips it can be concluded that there is a decrease in risk.

Are the conditions of Paris reproducible elsewhere in the Ile-de-France?

Paris is a territory apart in many aspects, and a number of criteria are particularly good for cycling: the quality of bicycle facilities, population profiles, proximity of the residence and workplace, cost of public transport and the low speed of the car (about 15 km / h in circulation excluding parking time). However, these criteria also exist elsewhere, all or part of, especially on the scale of the local area trips, and it is possible to imagine that the adapted cycling policies can also be bearing fruit.

Some actions that are carried out are long-term and involves a major reorganisation of the urban spaces originally calculated for the car (changing urban grid, spatial reconstruction). But actions on the road improvements, the marking out, the services to cyclists and education can be put to work in the short and medium term. Cycling can meet the needs of many proximity trips, to the shops, schools, some centres of employment and, of course, and the stations of the public transport network. We can also calculate that, based on an average of 13 km / h for a trip by bicycle, these are half the urbanised surface area of Paris and almost 70% of the population who are just 10 minutes from a train station.

The relevance of the bicycle policies appears thereby evident, so that those who want to, have the opportunity to practice cycling, and are maintained over time: if Strasbourg today has 13% of the bicycle modal share in the city centre, and 8% on the agglomeration scale, it is above all the fruit of over 30 years of policies in favour of this mode of transport.
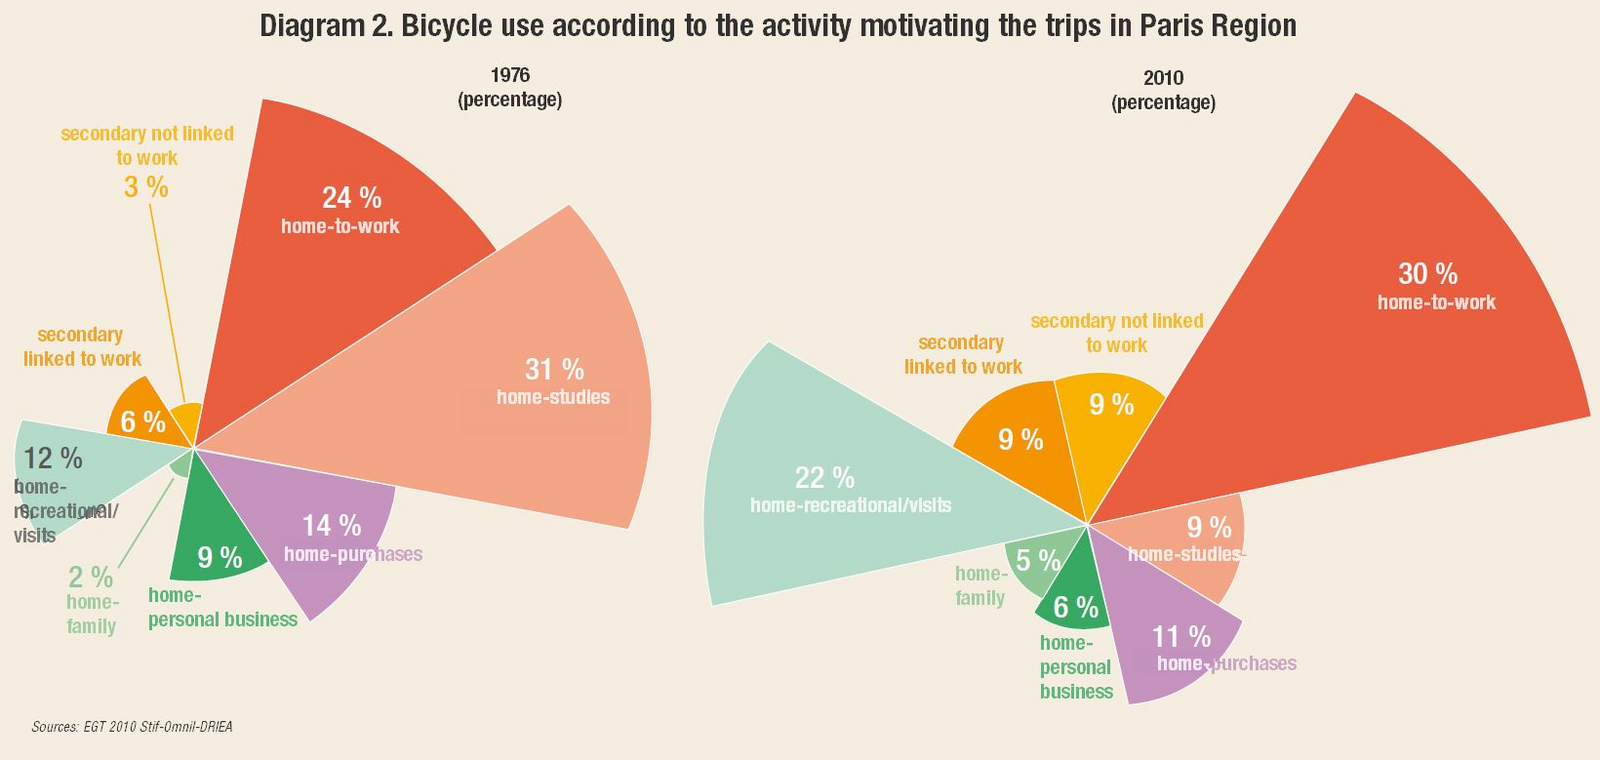
The bicycle, of course, is not intended to become a mode of transport at a "regional level", such as the car or the train, but it is clearly possible its use will progress in the different areas of local travel. Paris today on modal shares approaching around ten (8% internal commuting in Paris and up to 13% if we restrict them to male executives!) is indicative of the ability of this mode of transport to take its share in the mobility of Parisians.

1. Distance as the crow flies between the origin and destination of the trip.
2. Acronym for BOurgeois BOhemian to define the new urban upper class.
3. We are referring to trips having at least one end in Paris: both the internal trips to the capital, and those between the latter and the suburbs. What has not been taken into account are the trips from suburb to suburb passing through Paris, as it's more difficult to identify, but the importance is marginal.
4. Travel Observatory in Paris.

This page is linked to the following category :
Mobility