Continuous improvement in the average ecological footprint of residents of the Paris Region
Since 2004, L'Institut Paris Region has been measuring the ecological footprint of the Paris Region. To update this indicator in 2014, a new method, with a retroactive calculation, has enabled the results to be enriched. Analysis of that ten-year period assesses the gap between the ecological footprint and the biocapacity of the region, and sheds some light on its potential self-sufficiency.
Ecological footprint is a tool for calculating the productive land (and sea) area necessary for a person or for a society to supply the resources it consumes (for food, housing, travel, etc.), and to absorb the waste generated.
In order to estimate this human pressure exerted on the environment more conveniently, everything that is taken and discharged can be converted into equivalent “global hectares” (gha, cf. definition below).
The human footprint is then compared with the biocapacity (biological capacity) of the territory in question (see below for a glossary of terms), i.e. the land and sea areas that are said to be “bioproductive areas” and that are usable by humans. The gap between ecological footprint and biocapacity quantifies sustainability (see below for a glossary of terms) or “ecological sustainability”, which is characterised by a footprint that is no greater than biocapacity, and thus quantifies the scale of the efforts to be made to achieve it.
Ecological footprint also takes the environmental impacts into account where they take place, and attributes them to the end consumer: the impact of a product manufactured in China but used in France is thus attributed to France.
Average ecological footprint measured through five strategic items
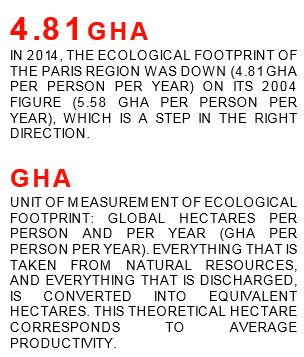
The ecological footprint of the Paris Region in 2014 (4.81 gha per person per year) remains greater than the average for France as a whole (4.66 gha per person per year). In 2004, the ecological footprint of France was 5.17 gha per person per year.
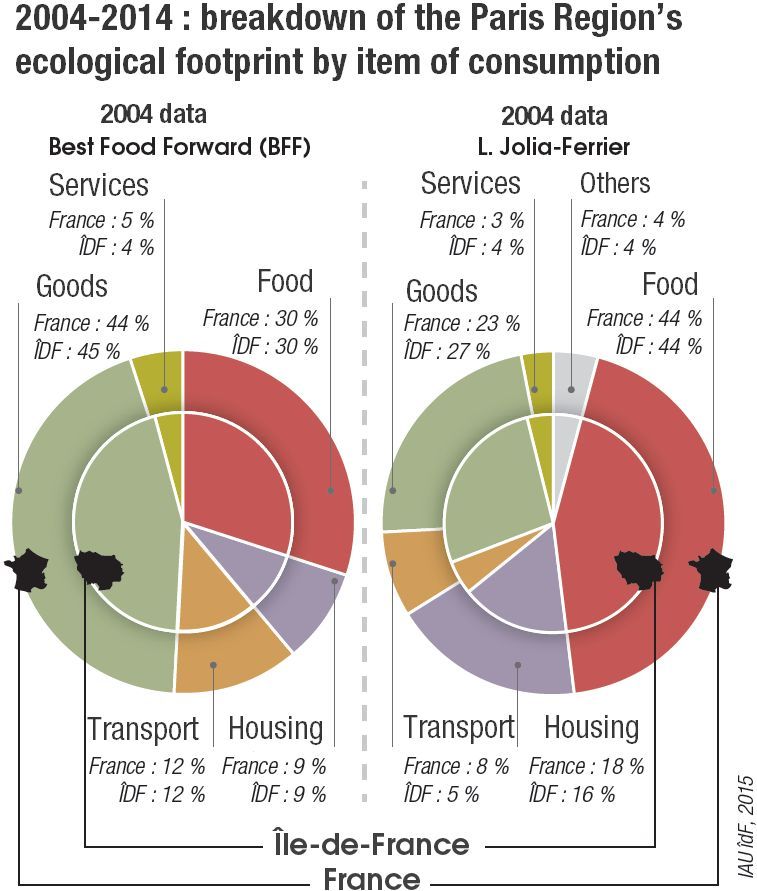
Three items of consumption (food, consumption of goods, and consumption of services) alone account for more than 75% of the ecological footprint of the Paris Region. Their footprint per capita is greater than the equivalent footprint per capita for France as a whole. For transport and housing, the reverse applies: the Paris Region has a footprint per capita smaller than that of France.
Food
In 2004, in the Paris Region, the ecological footprint relating to food was greater per capita than that of France by 0.07 gha per person per year. In 2014, it was greater by 0.02 gha per person per year.
Why?
- in the Paris Region, people eat out more, unlike their fellow citizens, and consume more exotic produce,
- the Paris Region, along with the Nord-Pas-de-Calais Region, is the French region in which the percentage of households who buy ready meals, which have a high ecological footprint, is the highest.
Consumption of goods
The results on this item should be interpreted with caution. Two different calculation methods were used for the two periods(1), and some of the data was unavailable. The important point is to compare the change in the structure of the ecological footprint.
As in 2004, it can be observed that people in the Paris Region consume more goods than the national average (2.49 gha per person per year as against 1.3 gha per person per year in 2014).
Why?
- the average disposable income is higher (by 20.4%).
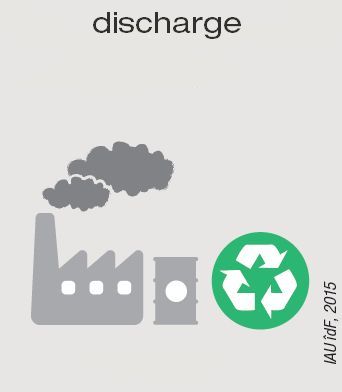
The human footprint on the environment: from harnessing resources to discharging waste (ecosphere)
Consumption of services
People in the Paris Region also consume more services than the national average (by 26.7% in 2014). In 2004, the ecological footprint was 0.25 gha per person per year. In 2014, it was 0.19 gha per person per year, according to the available data.
Why?
- the average disposable income is higher,
- supply, in particular in the field of culture, is abundant.
Housing
The ecological footprint of housing in the Paris Region is smaller per capita than that of France, all other things being equal. The average floor area per person of a dwelling in the Paris Region is smaller than the national average (32.6 m2 as against 39.8 m2, for the main residence). However, it should be noted that the energy consumption of the housing is higher in the Paris Region than in France (0.45 gha per person per year as against 0.41 gha per person per year).
Why?
- the share of electricity in the energy consumed by housing is significantly larger in France than in the Paris Region,
- the methodology of the Global Footprint Network (see below for a glossary of terms) attributes an ecological footprint of zero to electricity for France.
Transport
The footprint of transport is improving in the Paris Region (-0.1 gha per person per year). The growth in the mileage of private vehicles including motorcycles from 2004 to 2014 appears consistent, both at national level and at the level of the Paris region. The gap has widened from 2004 to 2014 (+14% nationally as against +11% in the Paris region), people in the Paris region using their cars less.
Why?
- the public transport networks in the Paris Region are increasingly dense,
- innovative sustainable transport or “soft mobility” tools (Vélib’ (city cycle hire), Autolib’ (city electric car hire and recharging of private electric vehicles), etc.) are booming,
- the road network is saturated,
- parking spaces are rare.
There is no significant change in the level of ecological footprint of transport by bus, coach, or rail (approximately 0.02 gha in all cases). As regards air transport, the development of low-cost and charter flights, with high load factors, is contributing to reducing the ecological footprint per person. The volume of greenhouse gas emissions is substantially constant, for any given aircraft and any given flight, regardless of the number of passengers. Therefore, the more passengers there are the lower the emissions per passenger.
In addition, the recession and environmental concerns have probably encouraged French companies to limit their business travel by air, by replacing it with new information technology tools (videoconferencing, online training, etc.).
2004-2014: consistency of the comparative study comparing the Paris Region and France as a whole
The ecological footprint of the Paris Region in 2014 (4.81 gha per person per year) is still larger than the French national average (4.66 gha per person per year, see the percentages per items in the diagram). However, the gap is narrowing compared with the 2004 study. The breakdown of this footprint between the various items of consumption remains consistent with the breakdown of the footprint for France.
Average ecological footprint per sample of the population
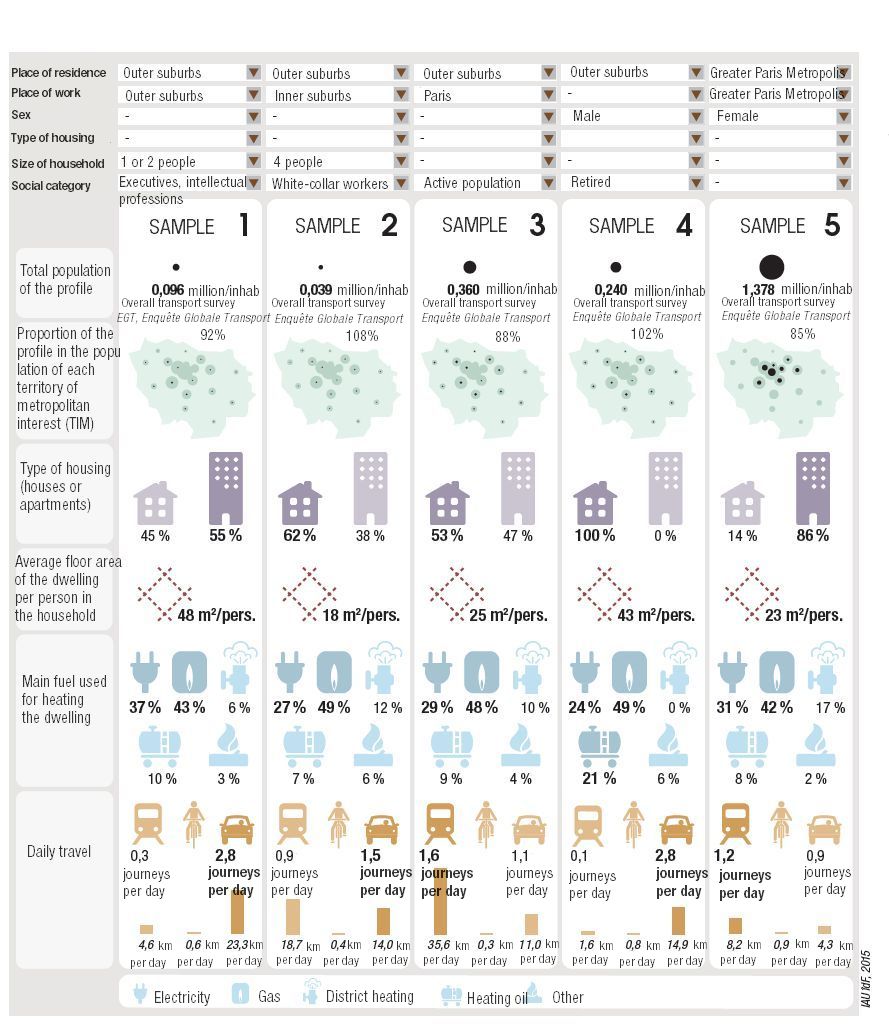
An experiment has been conducted to establish an average footprint for the Paris Region through five samples of the population taken by L'Institut Paris Region, determining Paris Region “profiles”. The initial premise was that, depending on the territory of residence, i.e. on whether it is urban, peri-urban or rural, the average footprint can change. It can be observed that the differences or gaps are even wider between people living within the same area (cf. the main results in the table below).
An innovative approach and an innovative methodology
To simplify the analysis, only the “housing” and “transport” items, which are the ones that are most representative of the ecological footprint, were studied for each sample (the values for the “food”, “goods”, “services” and “others” were not taken into account and are thus the same for all five samples). As a result, the difference between the average ecological footprint of the Paris Region and the average ecological footprint of a sample is not entirely representative of the reality of the region.
The average ecological footprint of each population sample was calculated using the dynamic tool that determines population profiles in the "territories of metropolitan interest” (TIMs, Territoires d’Intérêt Métropolitain).
It makes it possible to “spatialise” the profiles by considering various factors of the samples that are characteristic of the population of the Paris Region. These profiles take into account:
- the type of housing (houses or apartments),
- the average floor area of the dwelling per person in the household,
- the type of fuel used for heating the dwelling,
- daily travel (distances and modes of transport).
The housing ecological footprint
Two adjustment factors out of three were actuated:
- size of the dwelling,
- energy mix used for heating (electricity, natural gas, district heating, heating oil, and others).
The housing ecological footprint that is the smallest is that of sample No. 2 (white-collar workers living in the outer suburbs and working in the inner suburbs). Of the five samples, it is the one for which the average size of the dwelling for the number of people making up the household is the smallest (8.9% smaller than the average for the region). This results in a housing ecological footprint that is also smaller, in terms both of the land area used and of the quantity of timber consumed.
The highest housing ecological footprints are those of sample No. 1 (executives and intellectual professionals living and working in the outer suburbs) and of sample No. 4 (pensioners living in the outer suburbs). These are the two samples for which the average size of the dwelling for the number of people making up the household is the largest (respectively 50.6% larger and 46.8% larger than the regional average). This results in a housing ecological footprint that is more marked, in terms both of the land area used and of the quantity of timber consumed.
The transport ecological footprint
The adjustments related to travel on weekdays. The data giving travel at weekends and during holiday periods is not fine enough to be used.
The first salient feature of the ecological footprints related to transport or “mobility” of the first four samples is the very small difference relative to the regional average. This can be explained by the fact that:
- the weekly mileage travelled by private car (large unitary ecological footprint) is quite homogeneous between all four samples,
- local mobility accounts for about ¼ of the annual transport by private motor car.
The transport ecological footprint that is smallest is the one of sample No. 5 (female population living and working within the territory of the Greater Paris metropolis).
The differences observed cannot be explained by socio-professional category only. Although executives and intellectual professionals generally have an ecological footprint that is larger than average, those of them who are highly motivated, and who live and work in the city centre, have quite small ecological footprints.
The biocapacity of the Paris Region
At global level, biocapacity (see below for a glossary of terms) is 1.78 gha per person per year. In 2014, France’s biocapacity was 2.99 gha per person per year; and the Paris Region’s was 0.54 gha per person per year, as established using the data of the region’s land use map (MOS, mode d’occupation du sol) in 2012. The Paris Region thus has a biocapacity per capita that is quite substantially lower than that of France as whole (82% lower).
The gap between ecological footprint and biocapacity indicates that, like all metropolises, the Paris Region cannot be self-sufficient, in particular for energy. Having said that, what would the ecological footprint be for a Paris Region organised on the model of an average-sized provincial city, in which it is common for employees to travel from 50 to over 100 kilometres per day by car for commuting to and from work, and in which housing is mainly of the house type? Indeed, from the point of view of ecological footprint per capita, the major urban centres show good performance.
The improvement in the average ecological footprint of Paris Region residents over the ten years is significant, in particular since this composite indicator has high inertia (progress in one field can be counterbalanced by a regression in another). It reflects both the change in the behaviour of the population in matters of food, housing, transport, and consumption of goods and services, and also the efforts made by the public and private players and stakeholders in favour of the environment.
GLOSSARY
• Biocapacity: biologically productive land and sea area available per person on Earth.
• Sustainability: mode of development ensuring lasting availability of the resources necessary for satisfying the present and future needs.
• Ecological footprint: measurement of the pressure exerted by humans on the environment. It represents the area necessary for enabling a population to satisfy its consumption of resources, and for “absorbing” the waste that it has generated.
• Global Footprint Network (GFN): reference body for calculating ecological footprint, in particular for factors for converting into area (gha).
• GHA: measurement unit for ecological footprint (global hectares per person and per year).
Everything that is taken from natural resources, and everything that is discharged, is converted into equivalent hectares. This theoretical hectare corresponds to average productivity.
1. In 2004: Best Foot Forward (BFF). In 2014: Method of Calculating the Ecological Footprint of a Territory (CEET, Calcul de l’Empreinte Écologique du Territoire) developed by L. Jolia-Ferrier
This page is linked to the following category :
Environment

